Related Resources


Choosing the Right Visuals
Selecting appropriate visuals is essential for effective data communication in Power BI. Different types of data are best represented by specific visualizations. For instance, bar charts are suitable for comparing categories, line graphs excel at showing trends over time, and scatter plots are ideal for illustrating relationships between variables. By choosing the right visuals, you can ensure that your audience quickly grasps the key insights and messages you intend to convey.
Simplifying the Design
A clean and uncluttered design enhances the readability of your Power BI reports. Avoid using excessive colors, fonts, or visual elements that may distract from the core message. Instead, focus on using a consistent color palette, clear labels, and sufficient white space to make the visuals more digestible. Simplifying the design helps to maintain the viewer’s attention and enhances the overall impact of your data visualizations.
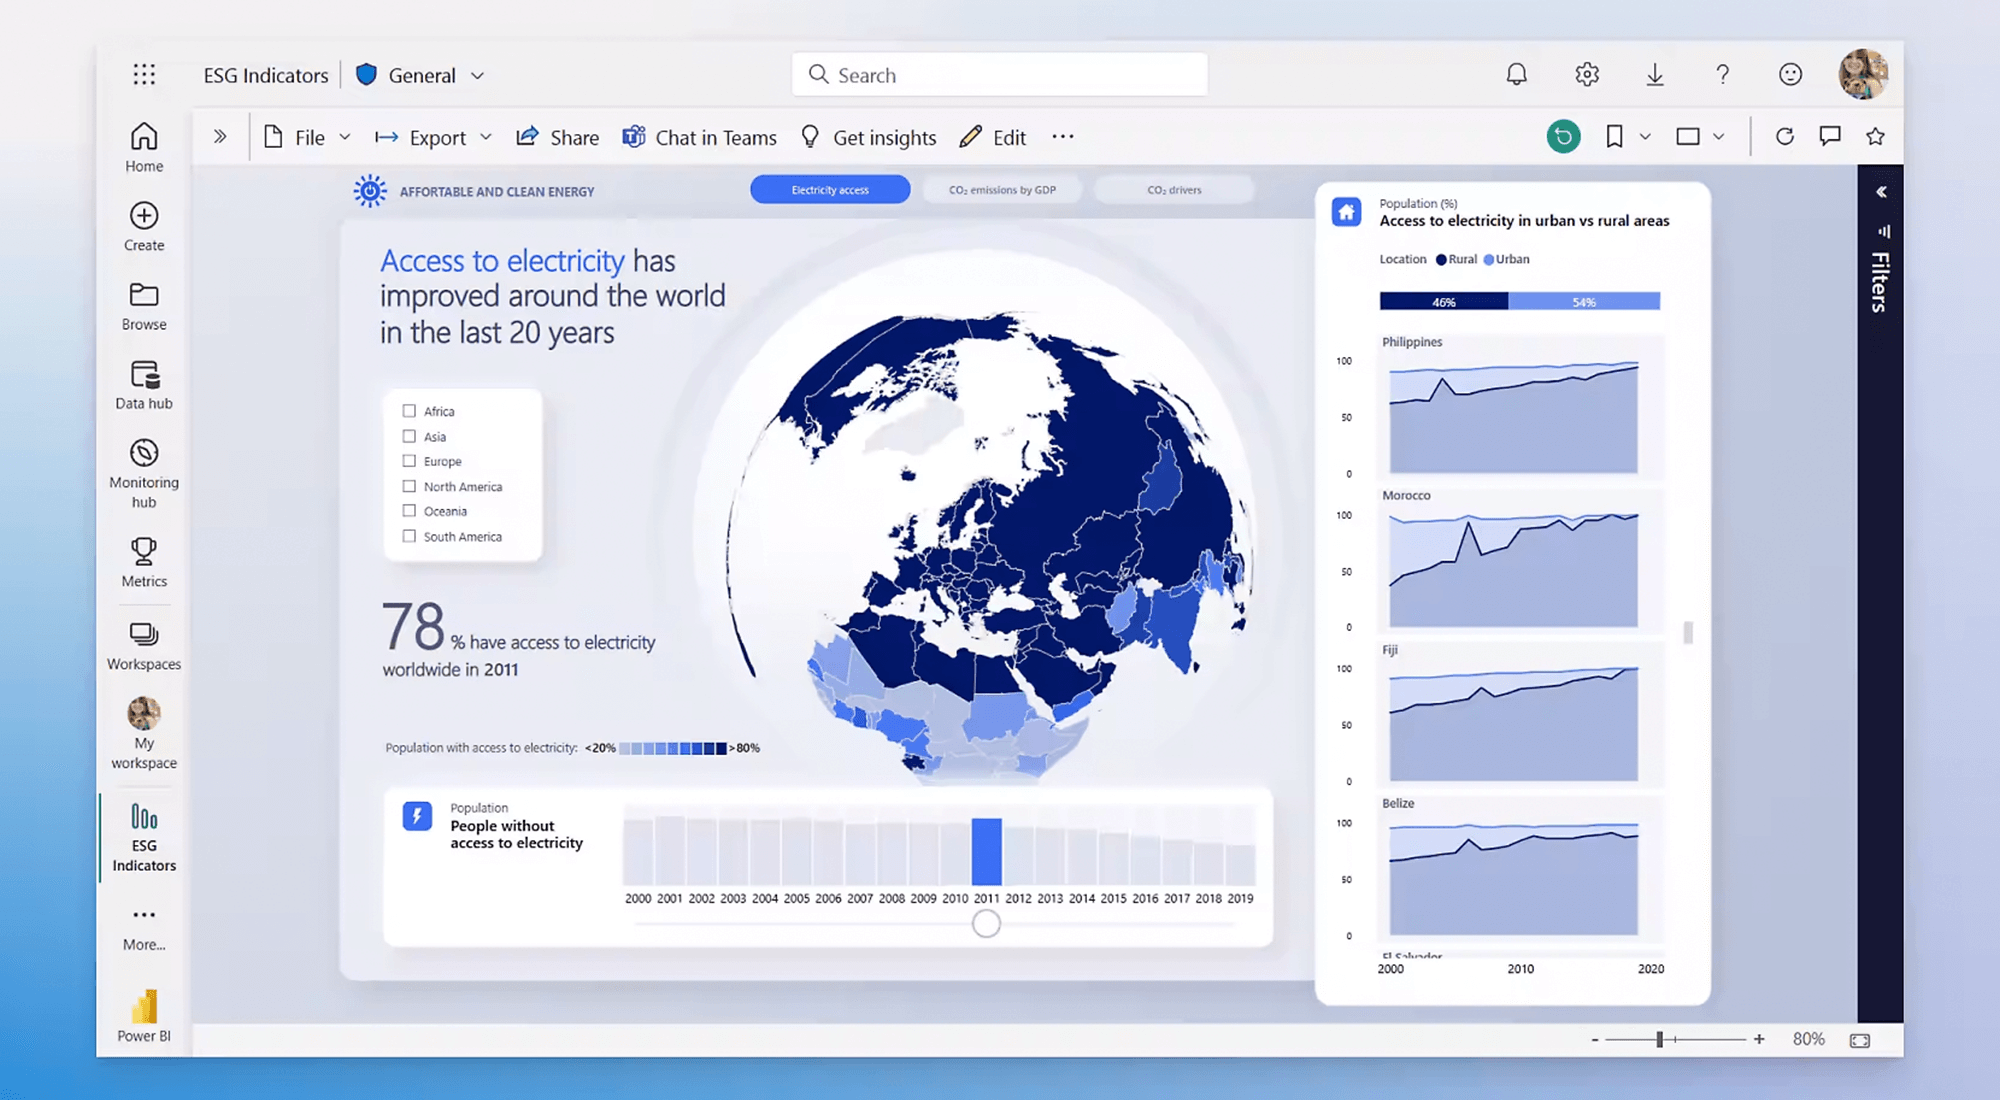
Utilizing Slicers and Filters
Power BI provides powerful tools like slicers and filters to make your reports more interactive and user-friendly. Slicers allow users to dynamically control which data segments are displayed, while filters can be used to narrow down the data based on specific criteria. By leveraging these interactive elements, you can create a more engaging and customizable experience for your report consumers, enabling them to explore the data in a way that is most relevant to their needs.
Adding Context with Titles and Annotations
Titles, subtitles, and annotations play a crucial role in providing context to your visuals. Clear and descriptive titles help the viewer quickly understand the main point of each visualization. Annotations can be used to highlight important data points or trends, offering additional insights without overwhelming the visual. By adding context through titles and annotations, you make it easier for your audience to interpret the data correctly and efficiently.
Ensuring Data Accuracy and Consistency
Accuracy and consistency are critical for trustworthy data visualizations. Ensure that your data is up-to-date, clean, and correctly aggregated before creating your visuals. Consistent use of scales, units, and formats across all visuals in a report maintains the integrity of the data presentation. Regular data validation and verification processes will help you maintain accuracy and build credibility with your report audience.
Emphasizing Key Insights
Highlighting key insights and takeaways helps your audience focus on the most important aspects of the data. Use techniques such as color contrasts, bold fonts, or callout boxes to draw attention to critical data points or conclusions. By emphasizing the key insights, you guide the viewer towards understanding the most significant findings of your analysis, making your visualizations more impactful and actionable.
Conclusion
Implementing best practices in data visualization using Power BI enhances the effectiveness and clarity of your reports. By choosing the right visuals, simplifying the design, utilizing interactive elements, adding context, ensuring data accuracy, and emphasizing key insights, you can create compelling and informative data visualizations that drive better decision-making. Investing time in mastering these practices will significantly improve your data storytelling skills, enabling you to communicate complex information more clearly and persuasively.
Reach out to talk more about Power BI!