Related Resources
Creating Impactful Visualizations
Our partners at Tableau stands out with their ability to create powerful and insightful data visualizations. By leveraging advanced techniques, users can transform complex data sets into compelling visual stories. Features such as calculated fields, parameter controls, and data blending allow for the customization and enhancement of visualizations. Users can create interactive dashboards that offer deep insights and facilitate decision-making. These advanced capabilities make it possible to highlight key metrics, identify trends, and uncover underlying patterns in the data.
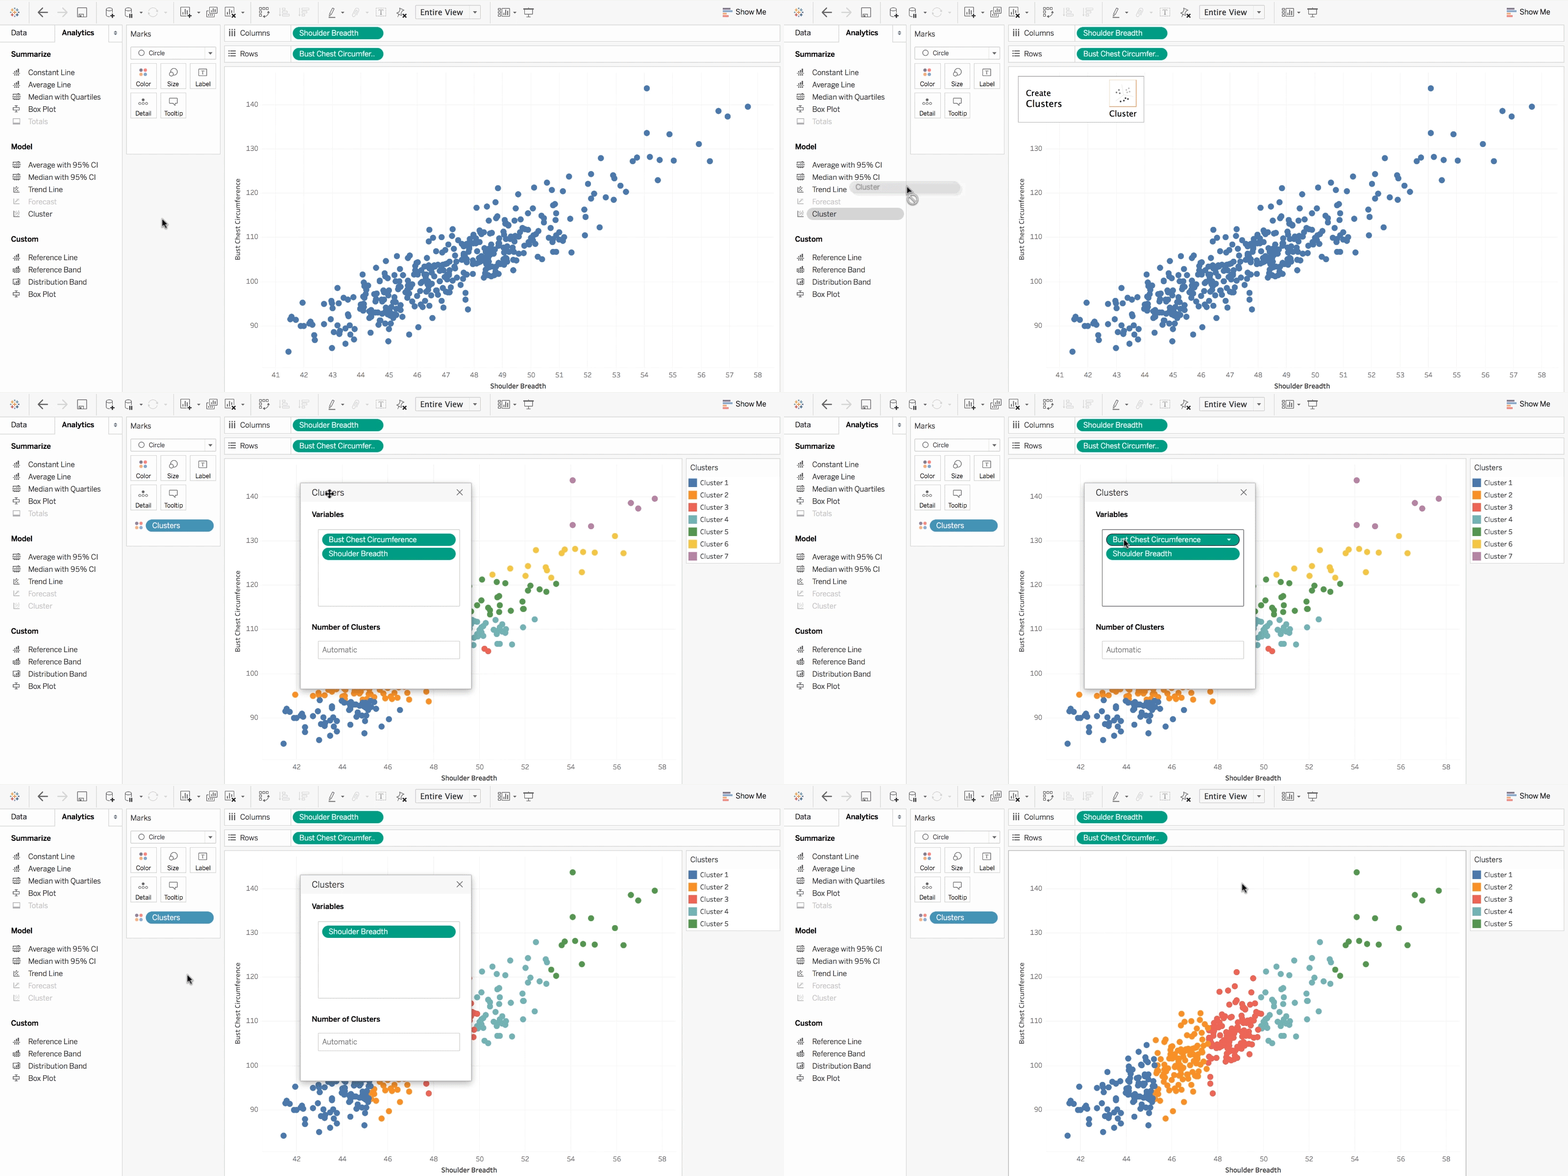
Image Source: Tableau
Utilizing Calculated Fields
Users can generate precise and meaningful metrics …useful for creating custom KPIs, segmenting data, and conducting detailed comparisons.
Calculated fields in Tableau enable users to perform complex calculations on their data, allowing for the creation of new data points that can enhance visualizations. These fields can be used to perform arithmetic operations, create conditional statements, and apply logical functions. By using calculated fields, users can generate precise and meaningful metrics that add depth to their analysis. This capability is particularly useful for creating custom KPIs, segmenting data, and conducting detailed comparisons.
Employing Parameter Controls
Parameter controls are a powerful feature in Tableau that allow users to add flexibility and interactivity to their visualizations. Parameters can be used to create dynamic changes in visualizations based on user inputs. For example, users can implement parameter controls to switch between different measures, modify filters, or change calculation values on the fly. This interactivity enhances the user experience and allows for a more tailored data exploration process.
Integrating Data Blending
By blending data, users can cross-reference information from different data sources to generate comprehensive insights.
Data blending in Tableau is an advanced technique that allows users to combine data from multiple sources into a single visualization. This is especially useful when dealing with disparate data sets that need to be analyzed together. By blending data, users can cross-reference information from different data sources to generate comprehensive insights. This technique enables a more holistic view of the data, providing a richer context for analysis.
Customizing Visual Elements
Customization of visual elements in Tableau enables the creation of unique and impactful visual representations of data. Users can tailor visualizations through a range of formatting options, including custom colors, shapes, and fonts. Additionally, advanced users can leverage the Tableau JavaScript API and Extensions to implement custom functionalities and further enhance the interactivity of their dashboards. These customizations ensure that the visualizations are not only informative but also visually engaging.
Leveraging Advanced Analytics
Tableau’s advanced analytics capabilities, such as forecasting, trend analysis, and clustering, enable users to delve deeper into their data. These tools allow for predictive modeling and identification of patterns that might not be immediately apparent. By integrating these advanced analytics techniques, users can derive more strategic insights and make data-driven decisions with greater confidence.
Streamlining Dashboards with Actions
Using actions in Tableau dashboards can significantly enhance interactivity and user engagement. Actions such as filters, highlights, and URL actions can be set up to respond to user interactions, creating a more dynamic and relevant data exploration experience. This functionality helps users to focus on specific areas of interest, drill down into details, and navigate through different levels of data with ease.
Conclusion
By exploring and applying advanced data visualization techniques in Tableau, users can create impactful and engaging visualizations that provide deep insights into their data. Calculated fields, parameter controls, data blending, customization options, advanced analytics, and the use of actions collectively enable users to maximize the potential of their data. Mastering these techniques ensures that visualizations are not only informative but also compelling, facilitating better decision-making and driving business success. Embracing advanced features in Tableau transforms raw data into a strategic asset, empowering organizations to uncover hidden opportunities and gain a competitive edge.
Want to learn more about Tableau? Get in touch with Bronson.AI – we’d love to see how the Tableau platform could enhance your organization.


